-
Websites as graphs ?
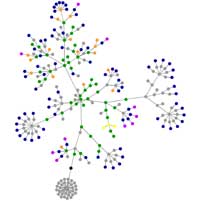
Posted on June 4th, 2006 No commentsHere is a neat graphic visualization of my blog. The different nodes represent different html tags. Each color has a different meaning: links are in blue, tables in red, DIVs in green, images in violet, and so forth. Quite an interesting representation, don’t you think ?
You can view the graph and how it is created by clicking on the image…

Leave a reply


